Theme

Blog

  • A drawing of a man with his arms and legs spread out. He is wearing a blue shirt and light blue pants. Ripples surround him, as if his body is imprinting into the background. The background is a light orangish brown color. He has a stoic expression.

    Going Beyond the Build

    Reflecting on a year of growth at Bluehouse Group, this blog explores the values of creating meaningful experiences, building connections, and embracing personal and professional transformation

  • On a teal background is a drawing of a thin timer, the timer reads 28 seconds in large red text.

    How Countdowns and Their Intent Shape the User Experience

    Learn why countdowns may not always meet your user experience goals effectively. Uncover real-world examples and valuable insights to better optimize how you use countdowns

  • An image of numerous nondescript green popup windows stacked on top of each other. They have little detail and no text but feature small X’s in the top right corner indicating they can be closed. All the popup windows are set against a light blue background.

    Popups vs. User Experience: Finding the Sweet Spot

    Learn how different types of popups affect user experience and discover best practices to minimize negative impacts while boosting conversions.

  • A cartoon person standing in front of a large screen displaying common update icons, such as a cloud with a down arrow and a gear with a percentage value, set against a solid green background.

    Strategies for Adapting to Major Software Changes on Your Website

    Learn how to manage major software changes for your website. Discover essential tips on planning, testing, and monitoring to ensure smooth transitions and optimal performance.

  • How to Setup Google Analytics 2024 written on a light blue background in black text, accompanied by an illustration of a person surrounded by charts, graphs, and gears, symbolizing data analysis.

    How to Setup Google Analytics (2024)

    Explore Bluehouse Group's step-by-step guide on setting up Google Analytics 4 to enhance your website's tracking capabilities and help you achieve your goals.

  • A drawing of a person sitting with their legs crossed, using a laptop. Around the drawing are lines connecting to another drawing of blue and white blank shopping tags. Above the drawings, in black bold letters reads, How to Set Up Google Tag Manager in 2024.

    How to Setup Google Tag Manager in 2024

    Learn how you can accelerate your analytics tracking with Google Tag Manager, streamline the implementation of custom data tracking codes without relying on developers.

  • On a gradient background of purple and turquoise, a white icon of a phone is featured, the phone is displaying a bar graph data table. Other data-related icons, including a magnifying glass, accompany the phone icon.

    A Guide to UTM Tracking (2023)

    Follow our step-by-step guide to navigate UTM Tracking. Learn the ins and outs along with the best practices for creating UTM Tracking codes in 2023

  • Clouds, dice icons, video game controller icons, and the Extra Life logo are set against a blue background. Written on top of the clouds, in bubble letters, it reads: Bluehouse Group is joining Extra Life on Saturday, November 4th, to support UVM Children's Hospital.

    A Day of Gaming at Bluehouse Group - Extra Life 2023

    Bluehouse Group is gaming all day on November 4th to raise money for UVM Children's Hospital through Extra Life. Learn more about our plans and fundraising goals!

  • An icon of a white path curvy path connecting an arrow to a target symbol. The path has circular checkpoints along the way. The entire path icon is set against a vibrant blue and purple gradient background

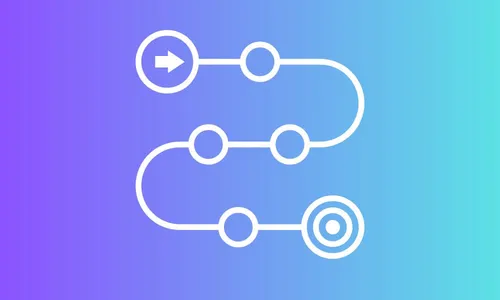
    Bluehouse Group’s Custom Software Development Process

    Bluehouse Group reveals our two-phase approach, starting with a Discovery & Design phase, followed by a Development & Launch phase. This ensures cost-effective, high-performance software.

  • A large group of people are standing and sitting around a table. Everyone in the group is listening to a women presenting at the center of the table. There are papers, markers, pens, and sticky notes on the table. While not visible in the image, the papers contain notes, ideas, and low fidelity wireframes with UX and UI solutions for an Open Data Portal for the city of Burlington, the women is presenting these ideas.

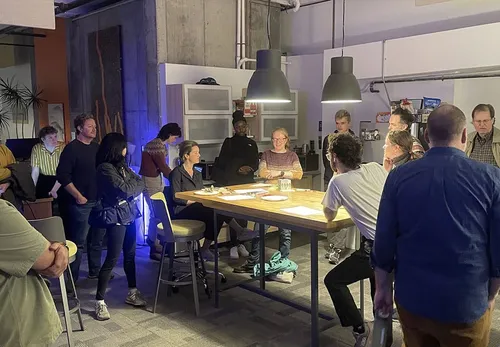
    UX/UI Design Jam - Burlington VT Open Data Portal

    Every month Bluehouse Group hosts a UX/UI meetup in Burlington, Vermont. For Fall we ran a Design Jam helping the City of Burlington with an open data portal website.

  • An illustration of a black and purple megaphone announcing Myths vs Facts. The megaphone icon is set against a vibrant blue and yellow gradient background

    5 Software Development Myths and Misconceptions

    Bluehouse Group debunks the myths and misconceptions surrounding software development to provide an accurate understanding of the industry for prospective partners

  • An illustration of a black phone screen reads "MVP" in all caps, with a gear underneath the text. The phone icon is set against a vibrant blue and green background

    MVP or Prototype? A Guide by Bluehouse Group

    Discover how Bluehouse Group can bring your vision to life with either a Minimum Viable Product (MVP) or a prototype. Learn what is the best solution for your idea